Back
21 Nov 2022
USD Index Price Analysis: Initial up barrier comes at the 100-day SMA
- DXY adds to the ongoing rebound and approaches 108.00.
- Further upside could see the 100-day SMA near 109.20 revisited.
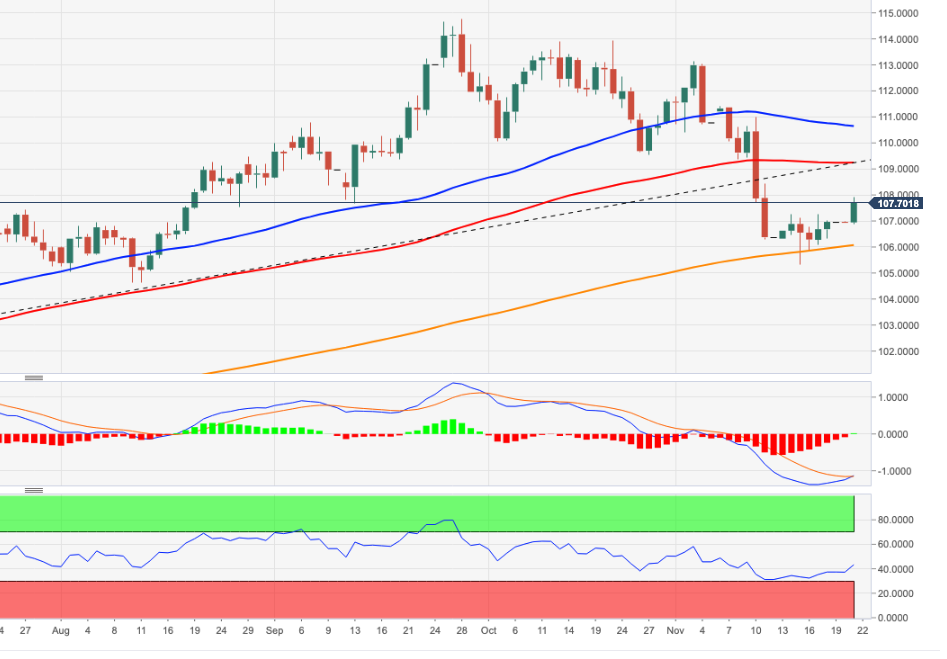
DXY advances for the third session in a row and trades at shouting distance from the key barrier at 108.00 on Monday.
The continuation of the uptrend targets the temporary hurdle at the 100-day SMA, today at 109.18, prior to the resistance line around 109.70. The surpass of the latter could prompt gains to pick up pace in the short-term horizon.
While above the key 200-day SMA at 105.11, the outlook for the index should remain constructive. This region is also reinforced by the November low at 105.34 (November 15).
DXY daily chart