USD/INR Price News: Indian Rupee buyers flex muscles with eyes on 81.50
- USD/INR holds lower ground near intraday bottom after two-day downtrend.
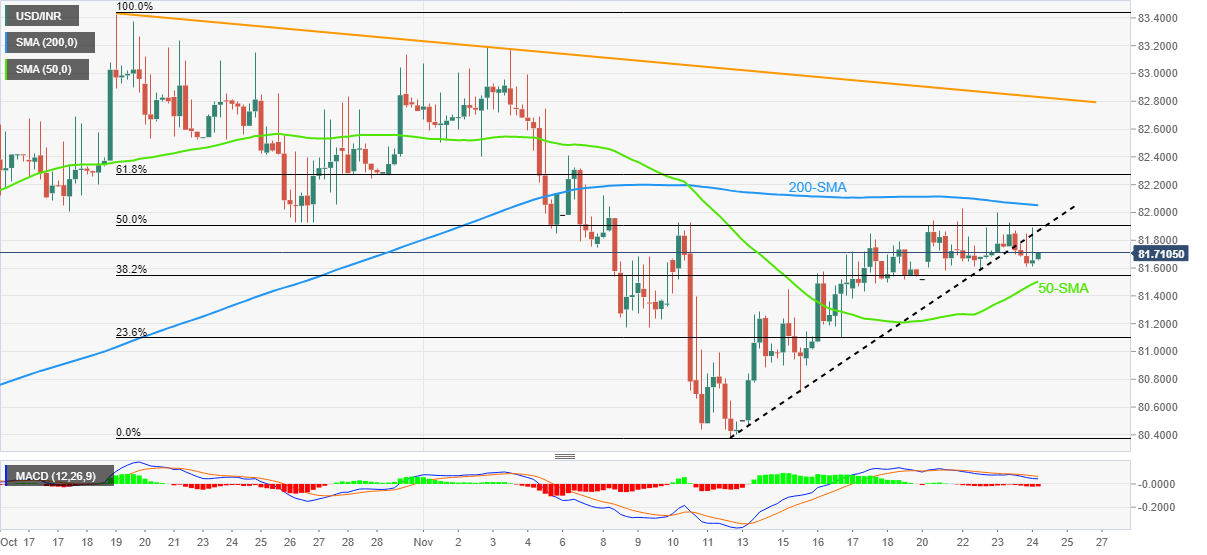
- Clear break of two-week-old ascending trend line favors intraday sellers to aim for 50-SMA.
- 200-SMA acts as an extra filter towards the north.
USD/INR remains pressured for the third consecutive day, holding lower ground near the intraday bottom of 81.60 during early Thursday in Europe.
In doing so, the Indian Rupee (INR) pair justifies the previous day’s downside break of the fortnight-old support line, now resistance near 81.90.
Also keeping the USD/INR bears hopeful is the pair’s sustained trading below the 200-SMA, as well as the bearish MACD signals.
As a result, the quote is well-set to test the 50-SMA support of 81.50 during the immediate downside.
Following that, the early November swing low near 81.15 and the 81.00 round figure could entertain the pair sellers before highlighting the monthly trough near 80.40.
On the upside, a successful break of the 81.90 support-turned-resistance can direct USD/INR toward the 200-SMA level of 82.05.
Even if the quote remains firmer past 82.05, the 61.8% Fibonacci retracement level, also known as the golden ratio, of the pair’s October-November downside around 82.30 will be in the spotlight.
It’s worth mentioning that a five-week-old descending trend line near 82.85 acts as the last defense of the USD/INR bears.
USD/INR: Four-hour chart
Trend: Further downside expected