GBP/USD Price Analysis: Struggles to find acceptance above 1.2100 amid reviving USD demand
- GBP/USD scales higher for the second straight day, albeit lacks follow-through buying.
- The risk-off mood drives some haven flows towards the USD and caps gains for the pair.
- The technical setup supports prospects for an eventual break below the 200-day SMA.
The GBP/USD pair builds on the overnight bounce from the 1.1960 area, or over a one-month low and gains some positive traction for the second successive day on Wednesday. Spot prices, however, struggle to capitalize on the move or find acceptance above the 1.2100 mark and retreat around 35 pips from the daily top. The pair is currently placed around the 1.2075 region, still up over 0.30% for the day.
The prevalent risk-off environment - as depicted by a generally weaker tone around the equity markets - assists the safe-haven US Dollar to recover a major part of its intraday losses. This, in turn, is seen as a key factor acting as a headwind for the GBP/USD pair. That said, the prospects for an imminent pause in the Fed's rate-hiking cycle hold back the USD bulls from placing aggressive bets and remain supportive of the bid tone surrounding the major.
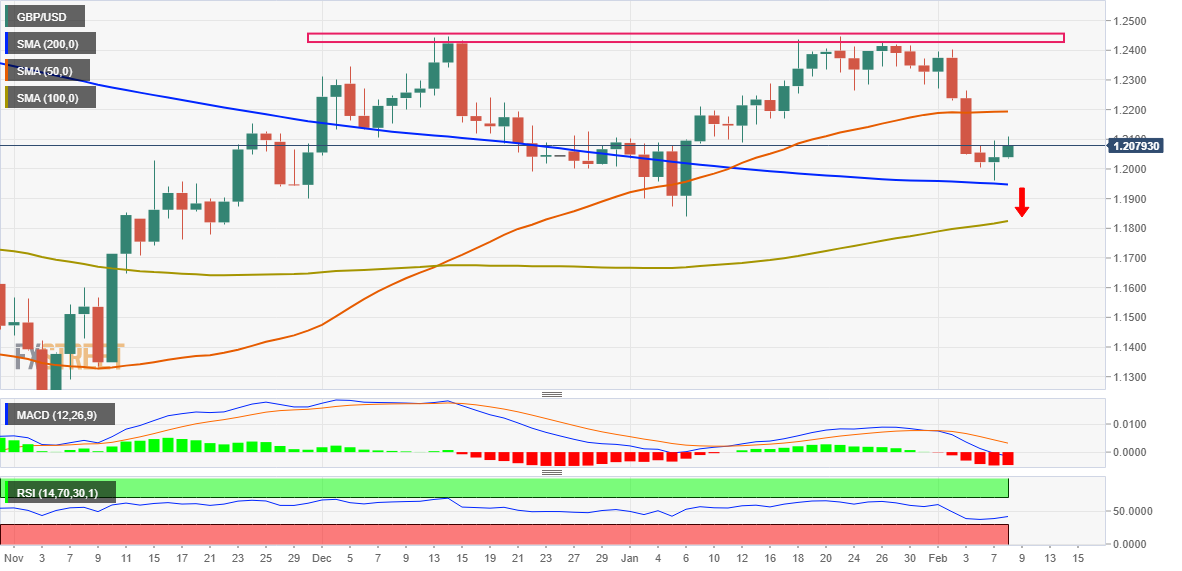
Looking at the broader picture, the recent repeated failures near the 1.2450 supply zone constitute the formation of a bearish multiple-top pattern on the daily chart. That said, the emergence of some buying near a technically significant 200-day SMA warrants some caution for bearish traders. This makes it prudent to wait for strong follow-through selling below the overnight swing low, around the 1.1960 zone before positioning for a further depreciating move.
With oscillators on the daily chart holding in the negative territory, the GBP/USD pair might then turn vulnerable to accelerate the fall towards the 1.1900 round figure. The downward trajectory could get extended further towards testing the YTD low, around the 1.1840 region touched on January 6, en route to the 100-day SMA, currently near the 1.1815-1.1810 area.
On the flip side, any meaningful rally beyond the 1.2100 mark is likely to confront stiff resistance ahead of the 1.2200 round figure. The latter coincides with the 100-day SMA, which if cleared might negate the bearish outlook and prompt some short-covering. The GBP/USD pair could then climb to the 1.2235-1.2280 barrier before aiming to reclaim the 1.2300 mark.
GBP/USD daily chart
Key levels to watch