WTI Price Analysis: Oil bears eye one more visit to $73.90 support
- WTI crude oil remains pressured after reversing from the key moving average, two-week-old resistance line.
- Bearish MACD signals, steady RSI suggest further declines in commodity price.
- 50% Fibonacci retracement level, four-month-old horizontal region appear the key short-term supports.
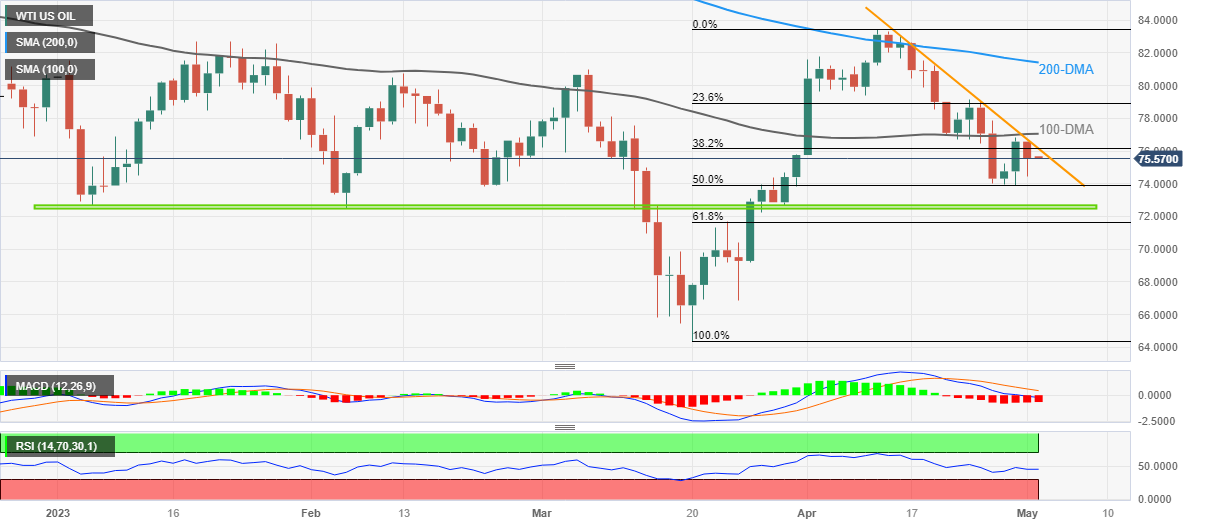
WTI crude oil stays depressed around $75.50 during the early hours of Tuesday’s trading, after snapping a two-day winning streak the previous day. In doing so, the black gold extends the week-start U-turn from the 100-DMA, as well as a downward-sloping resistance line from mid-April.
Given the bearish MACD signals and a steady RSI (14) line, the energy benchmark is likely to portray another attempt in breaking the 50% Fibonacci retracement of the quote’s March-April upside, near $73.90.
However, a horizontal area comprising multiple levels marked since early January, around $72.65-50, appears a tough nut to crack for the WTI crude oil sellers.
Also acting as short-term key support is the 61.8% Fibonacci retracement level surrounding $71.60, a break of which could recall $69.00 to the chart.
On the contrary, the aforementioned resistance line guards the immediate recovery of the WTI crude oil price near $76.20.
Following that, the 100-DMA and 23.6% Fibonacci retracement can challenge the Oil buyers around $77.00 and $79.00.
In a case where the commodity price remains firmer past $79.00, the $80.00 psychological magnet may act as the last defense of the Oil bears.
Overall, WTI crude oil is expected to decline further but the downside remains elusive unless the quote settles below $72.50.
WTI crude oil: Daily chart
Trend: Limited downside expected