Back
9 Aug 2019
USD/CAD technical analysis: Greenback erratic against CAD below the 1.3270 resistance
- The Canadian Dollar is gaining strength as crude oil is going up
- The levels to beat for bears are the 1.3200 level, followed by 1.3170 and 1.3140 supports on the way down.
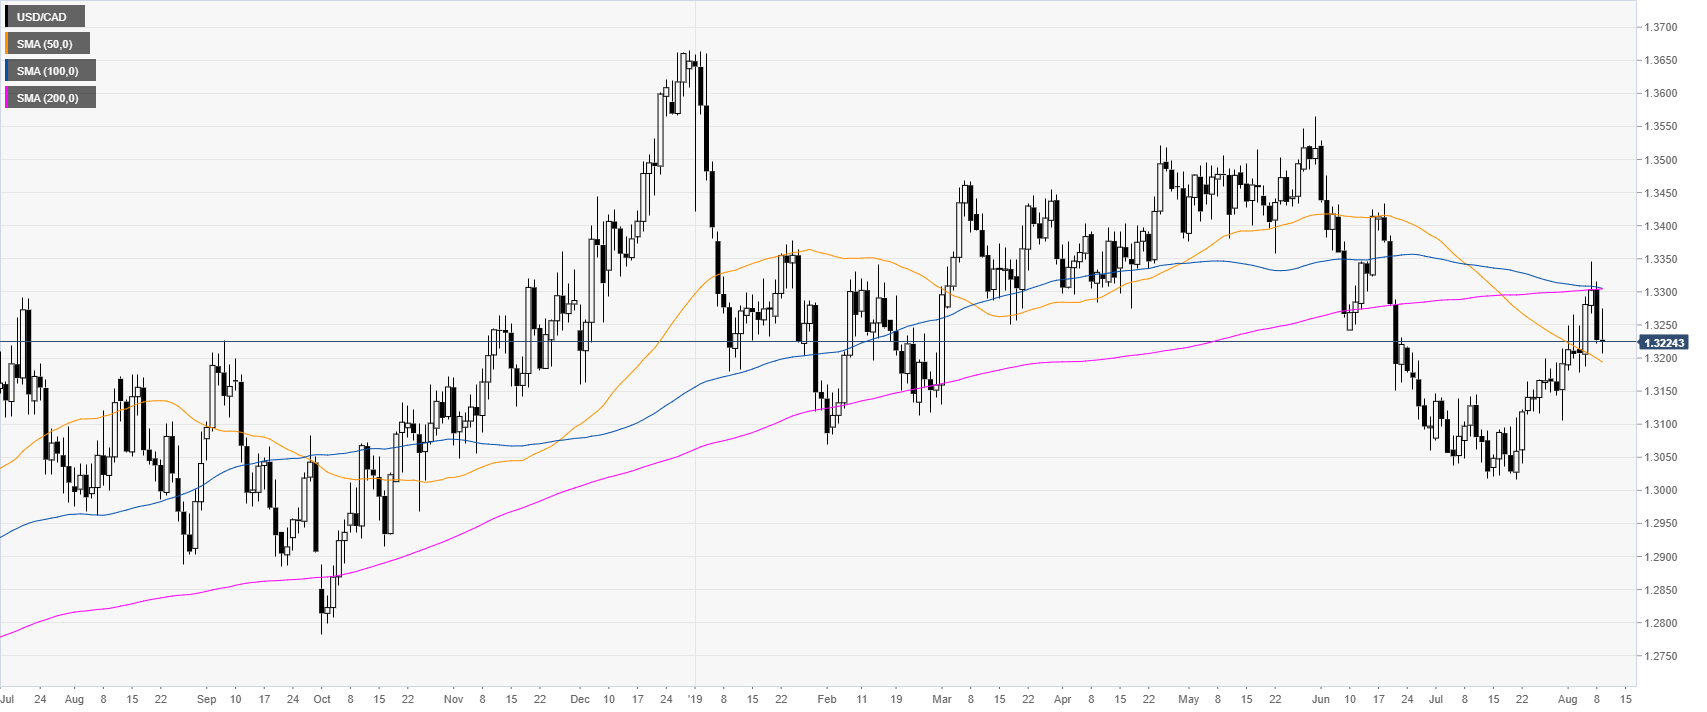
USD/CAD daily chart
USD/CAD is retreating the 1.3300 figure and the 100/200 day simple moving averages (DSMAs) as crude oil is trading up. The worse-than-expected employment data in Canada created the volatility in the New York session.
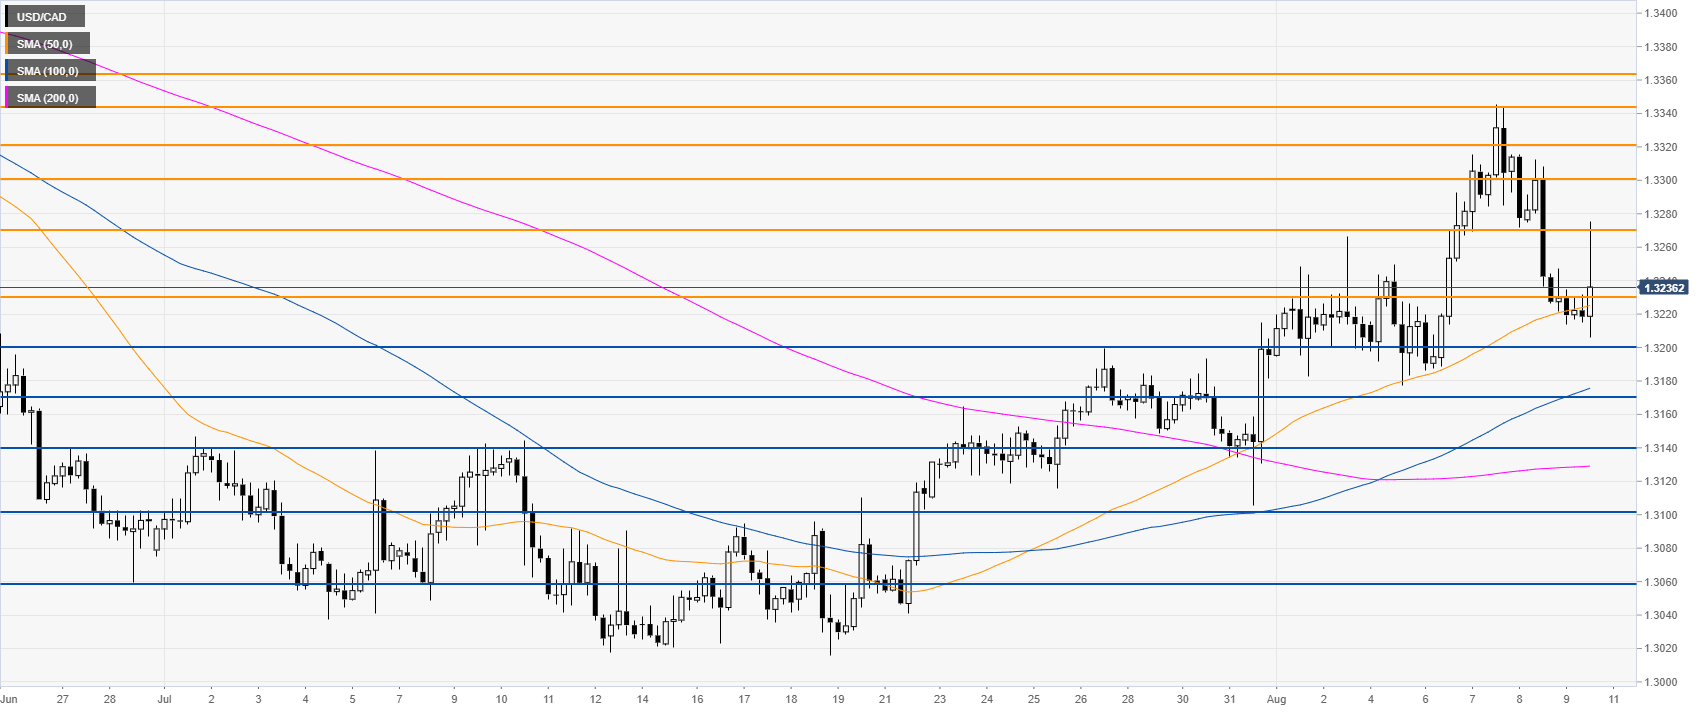
USD/CAD 4-hour chart
USD/CAD rejected the 1.3270 resistance a the market is testing the 1.3230 level and the 50 SMA. The market is being volatile and might be entering a range above the 1.3200 level, according to the Technical Confluences Indicator.
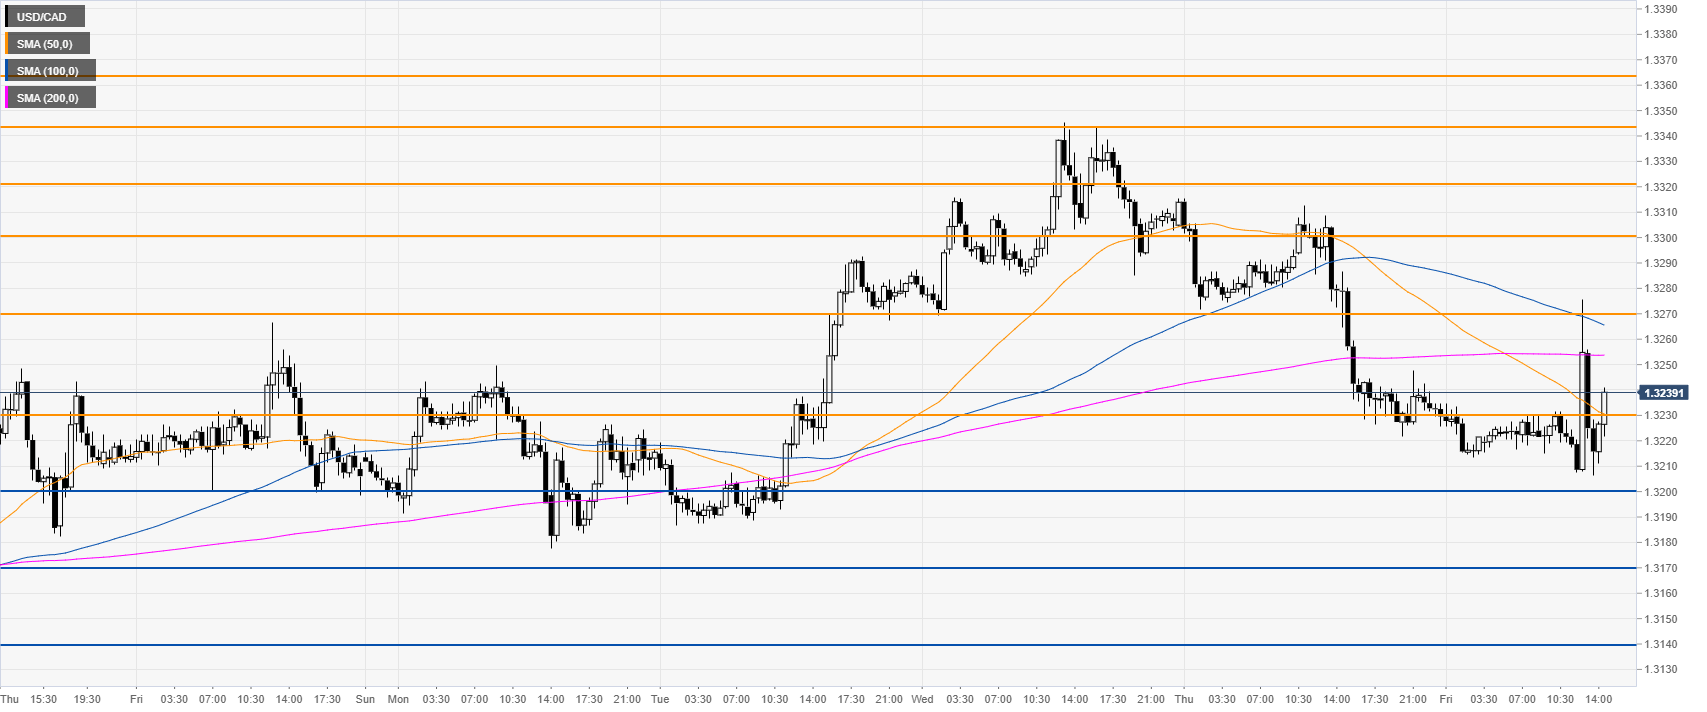
USD/CAD 30-minute chart
USD/CAD is evolving below its 100 and 200 SMAs, suggesting bearish momentum in the near term. Bears want a daily close below the 1.32000 figure to reach 1.3170 and 1.3140 on the way down, according to the Technical Confluences Indicator.
Additional key levels