Back
9 Aug 2019
US Dollar Index technical analysis: DXY ends the week within familiar ranges near the 97.55 level
- After the recent drop at the start of August, DXY is stabilizing near the 97.55 level.
- The level to beat for buyers are at the 97.80 level, followed by 98.10 and 98.38 resistances.
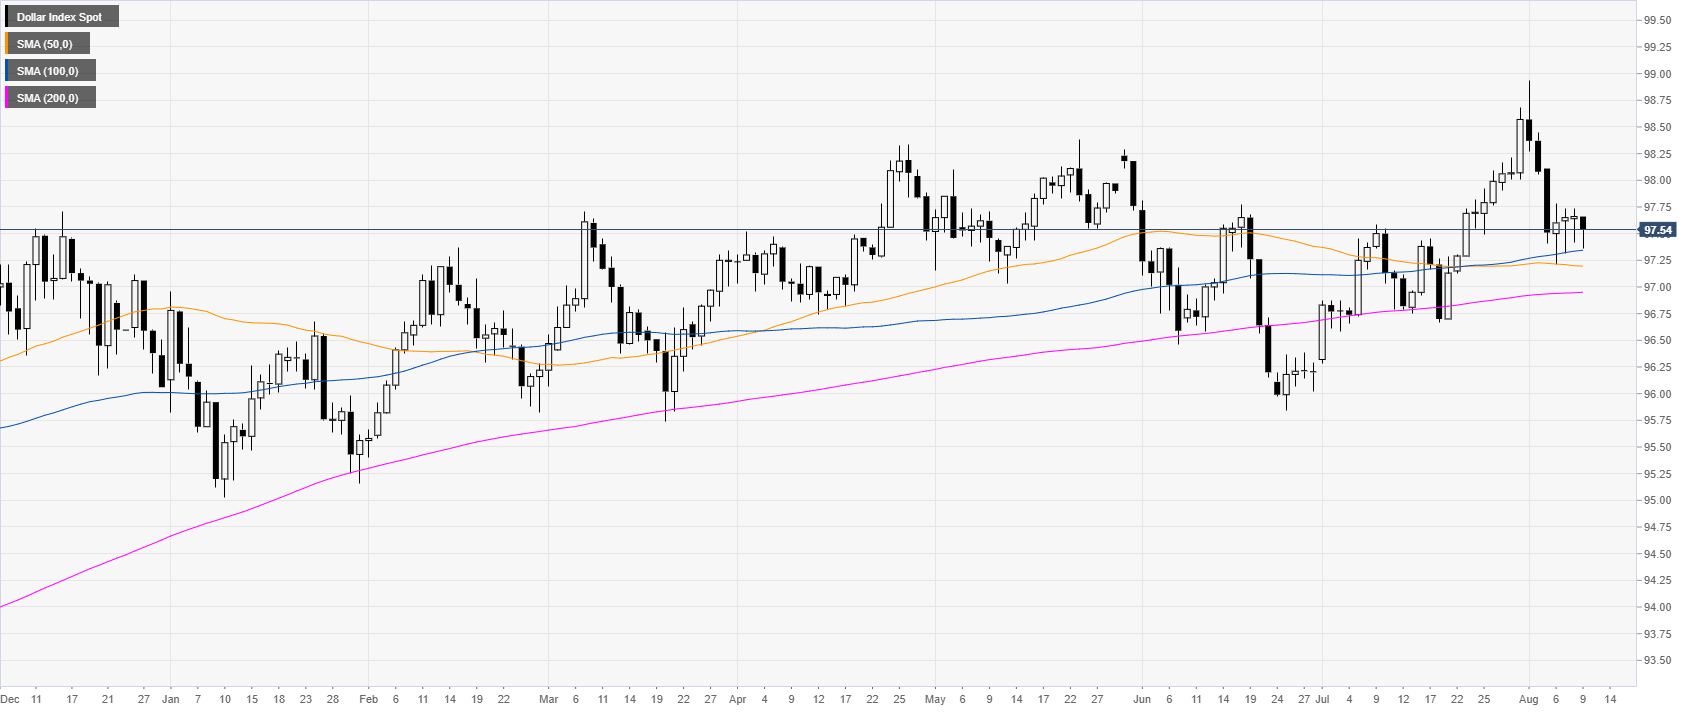
DXY daily chart
DXY (US Dollar Index) is trading in a bull trend above its main daily simple moving averages (DSMAs). DXY is attempting to find some support as the 10-year US bond yields are rebounding after falling sharply.
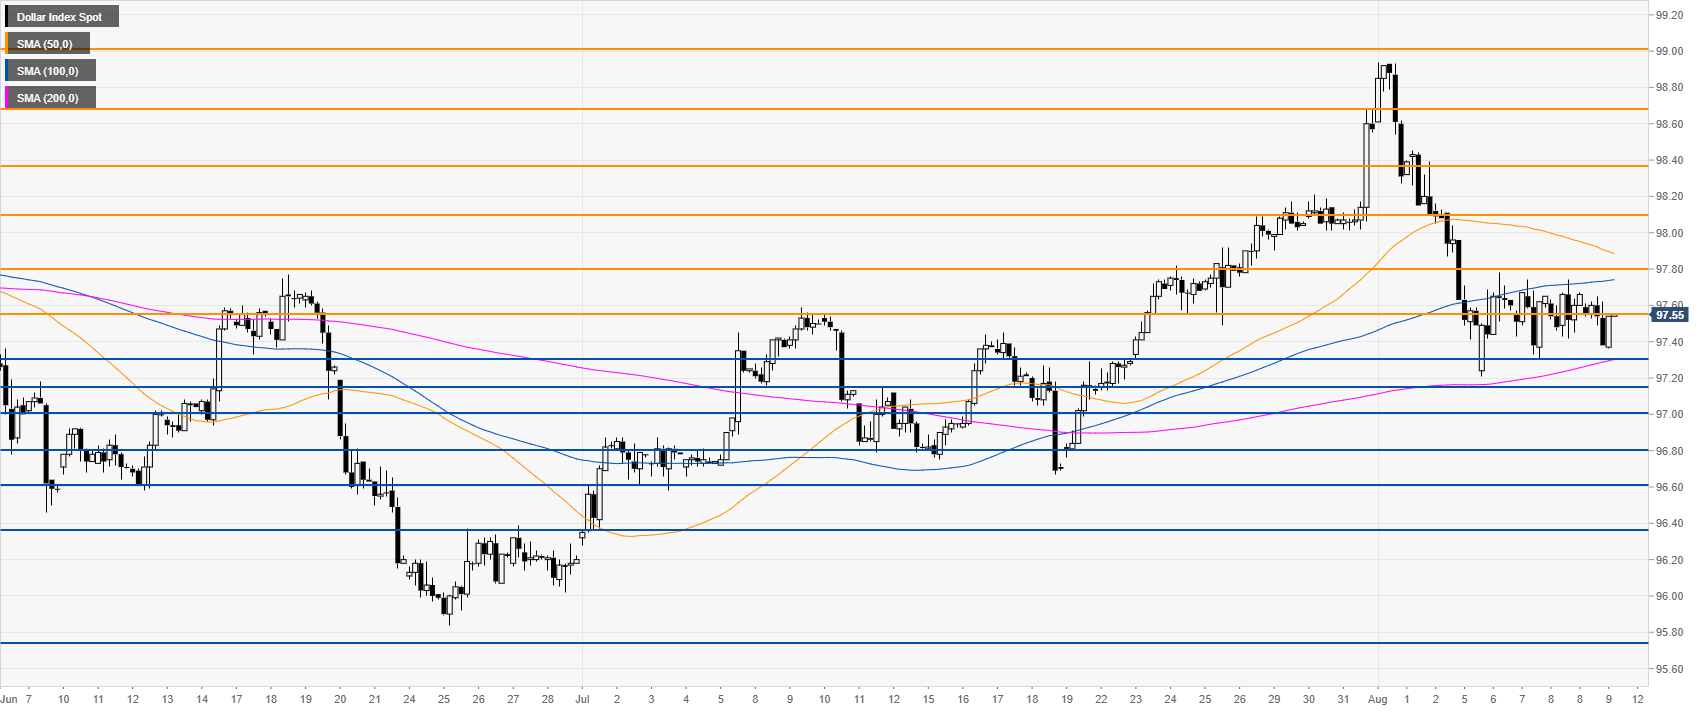
DXY 4-hour chart
DXY found support near the 96.55 level above the 200 SMA. The bulls need a clear break above the 97.80 resistance to reclaim the 98.10 level and the 50 SMA. Further up, buyers will look at the 98.36 resistance.
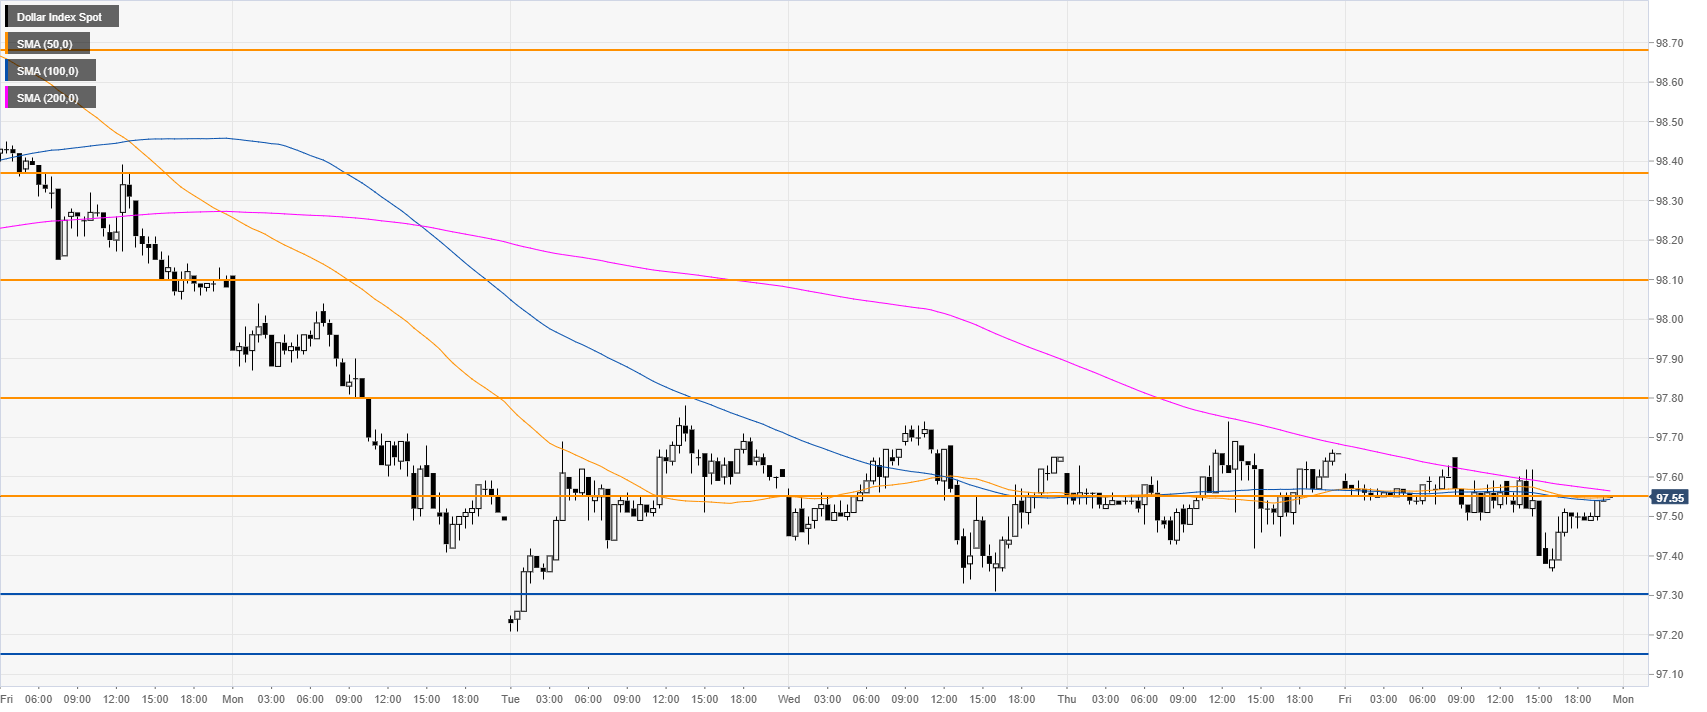
DXY 30-minute chart
The greenback has been consolidating its recent losses for the fourth consecutive day. However, a daily close below 97.15 could be seen as a potential bearish continuation towards the 97.00 figure.
Additional key levels