Back
17 Oct 2019
US Dollar Index technical analysis: DXY under heavy pressure breaks below September lows and 100 DSMA
- The US Dollar Index (DXY) is under heavy bearish pressure as the market broke below the September lows.
- DXY also broke below the 100-day simple moving average (DSMA) as the market is approaching the 200 DSMA.
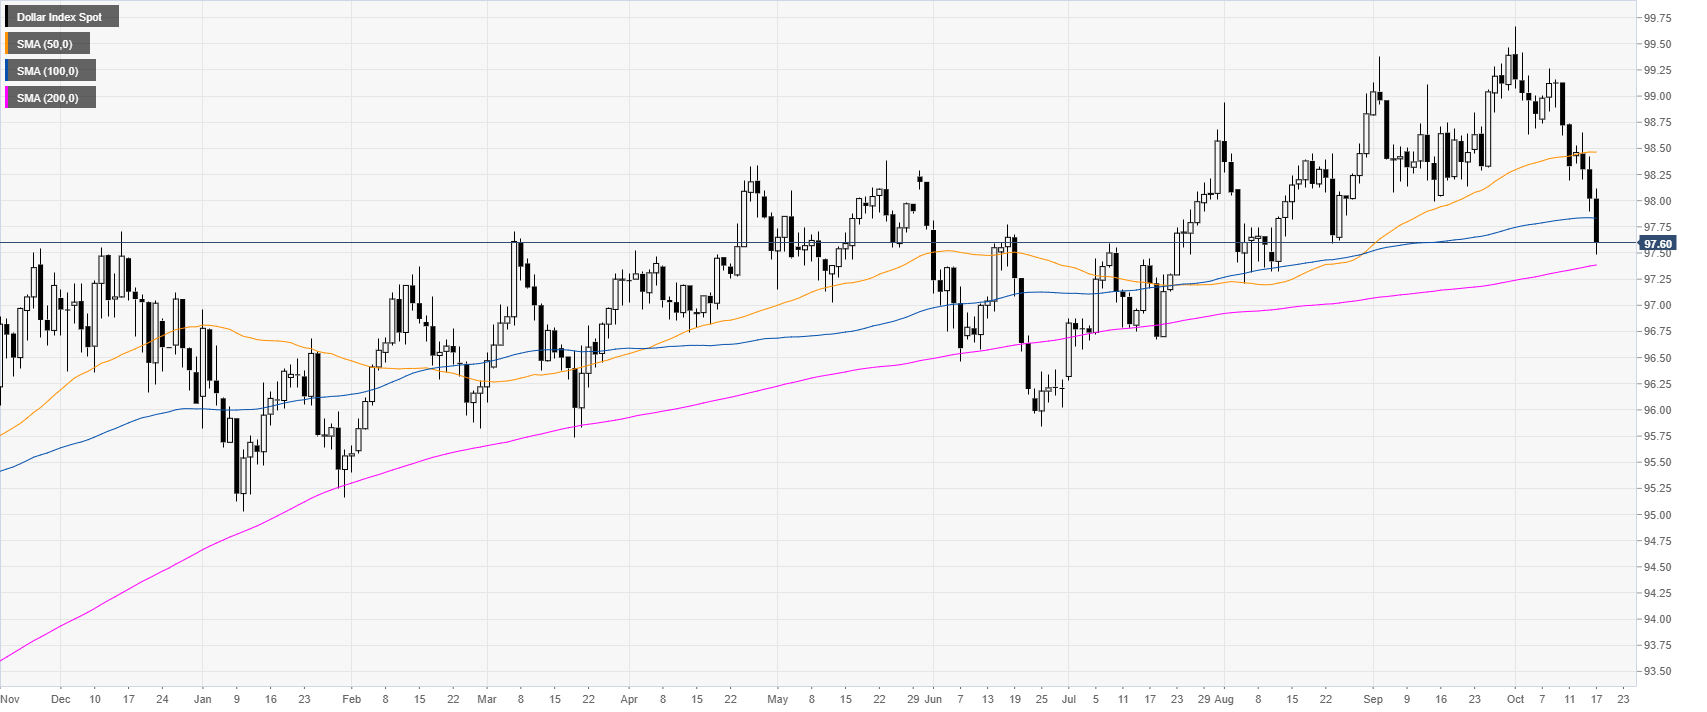
DXY daily chart
The US Dollar Index (DXY) is trading in a bull trend above the 200-day simple moving average (DSMA). However, this Thursday, the Greenback accelerated its decline breaking below the 100 DSMA en route towards the 200 DSMA today at 97.39.
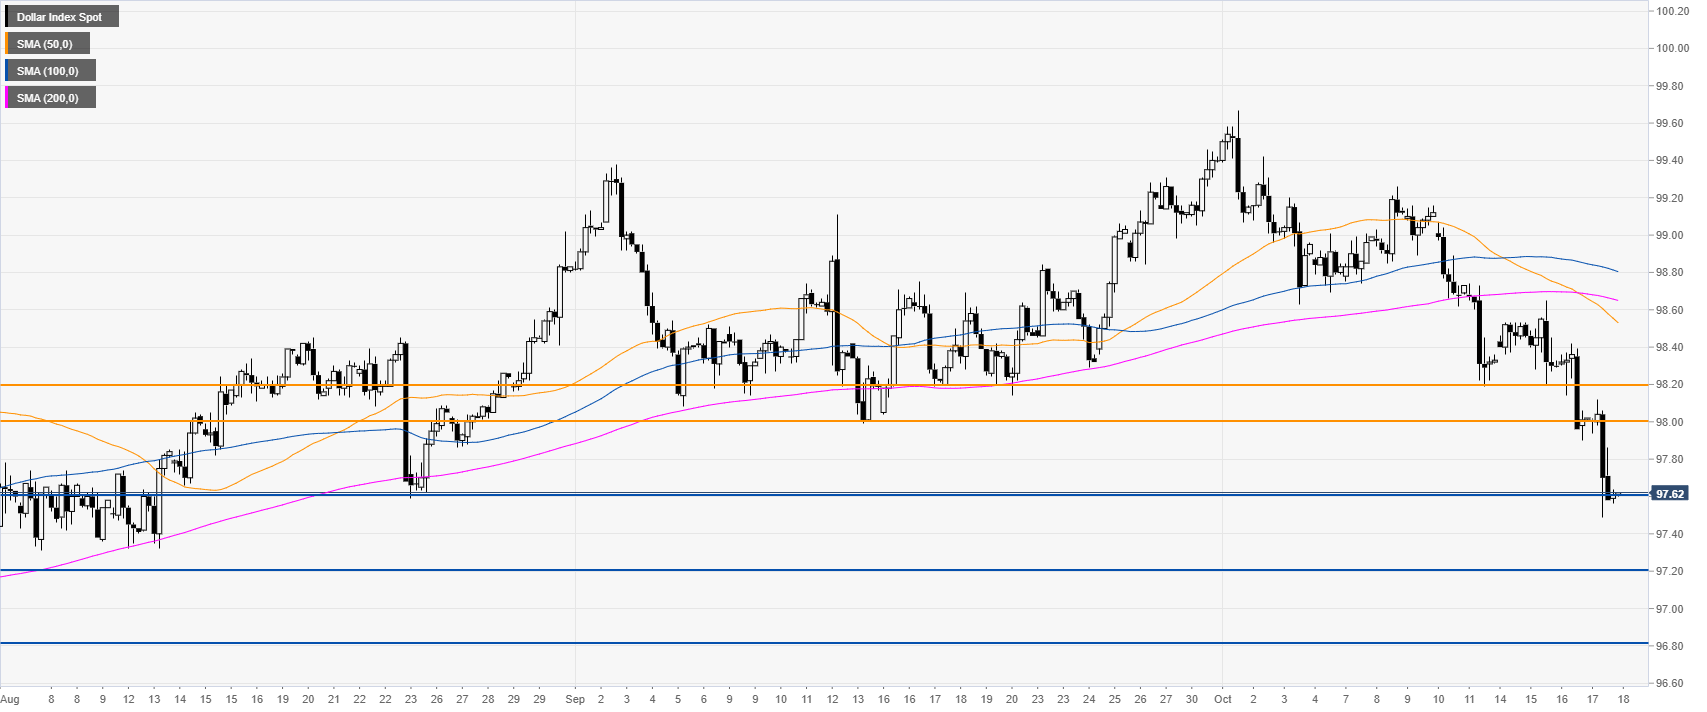
DXY four-hour chart
DXY is under heavy bearish pressure below the main SMAs. DXY reached the 97.60 support level. Given the strong momentum down, the support is not expected to hold and 97.20 and 96.80 can be next on the way down.
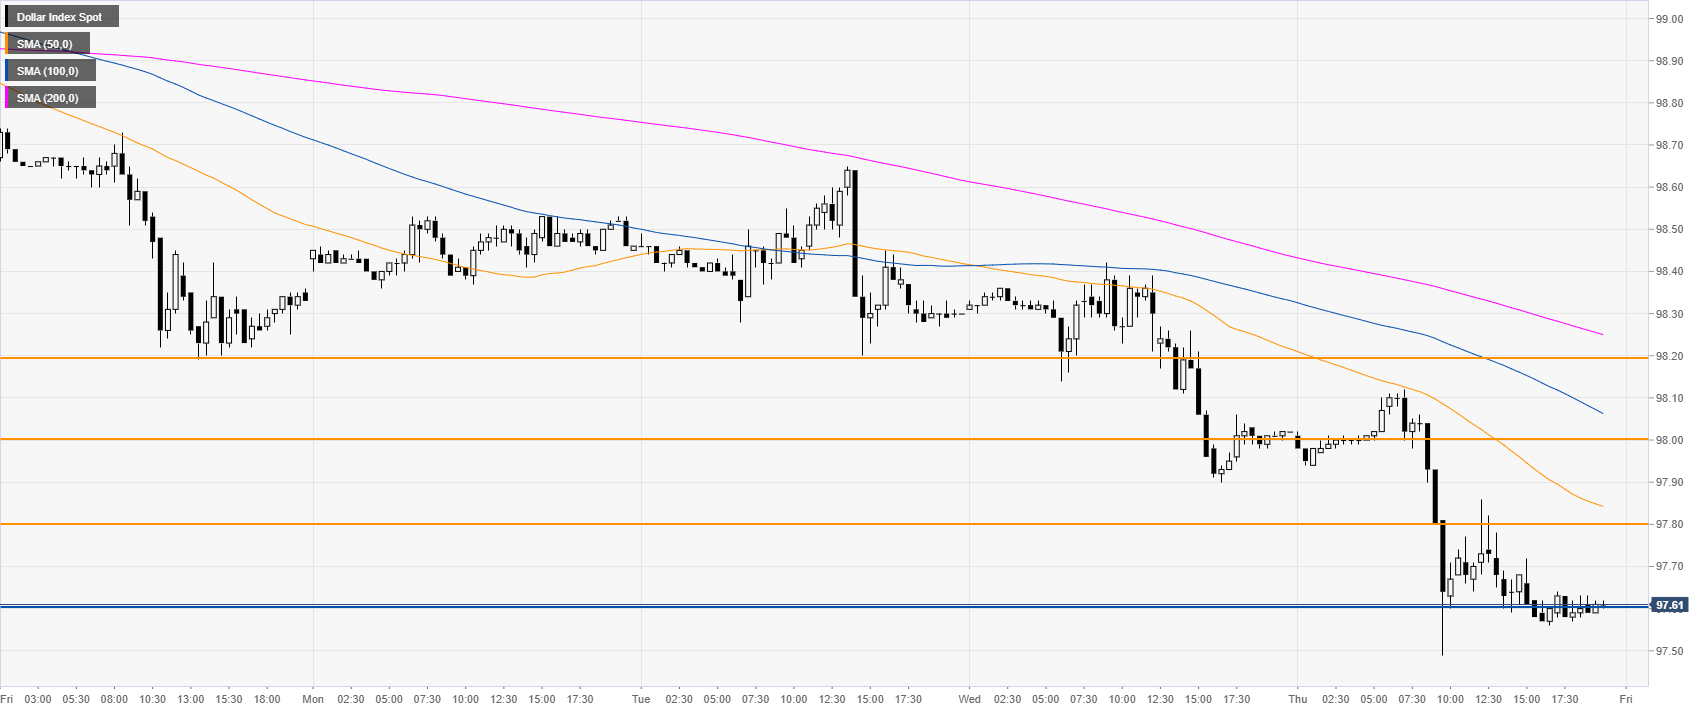
DXY 30-minute chart
DXY is trading below the main SMAs, suggesting a bearish bias in the short term. Resistances are seen at the 97.80, 98.00 and 98.20 levels.
Additional key levels