Back
26 Nov 2019
EUR/USD Technical Analysis: Fiber rolls into the Asian session below the 1.1020 level
- EUR/USD is starting the week with a slow drift down.
- The level to beat for sellers is the 1.0996 support.
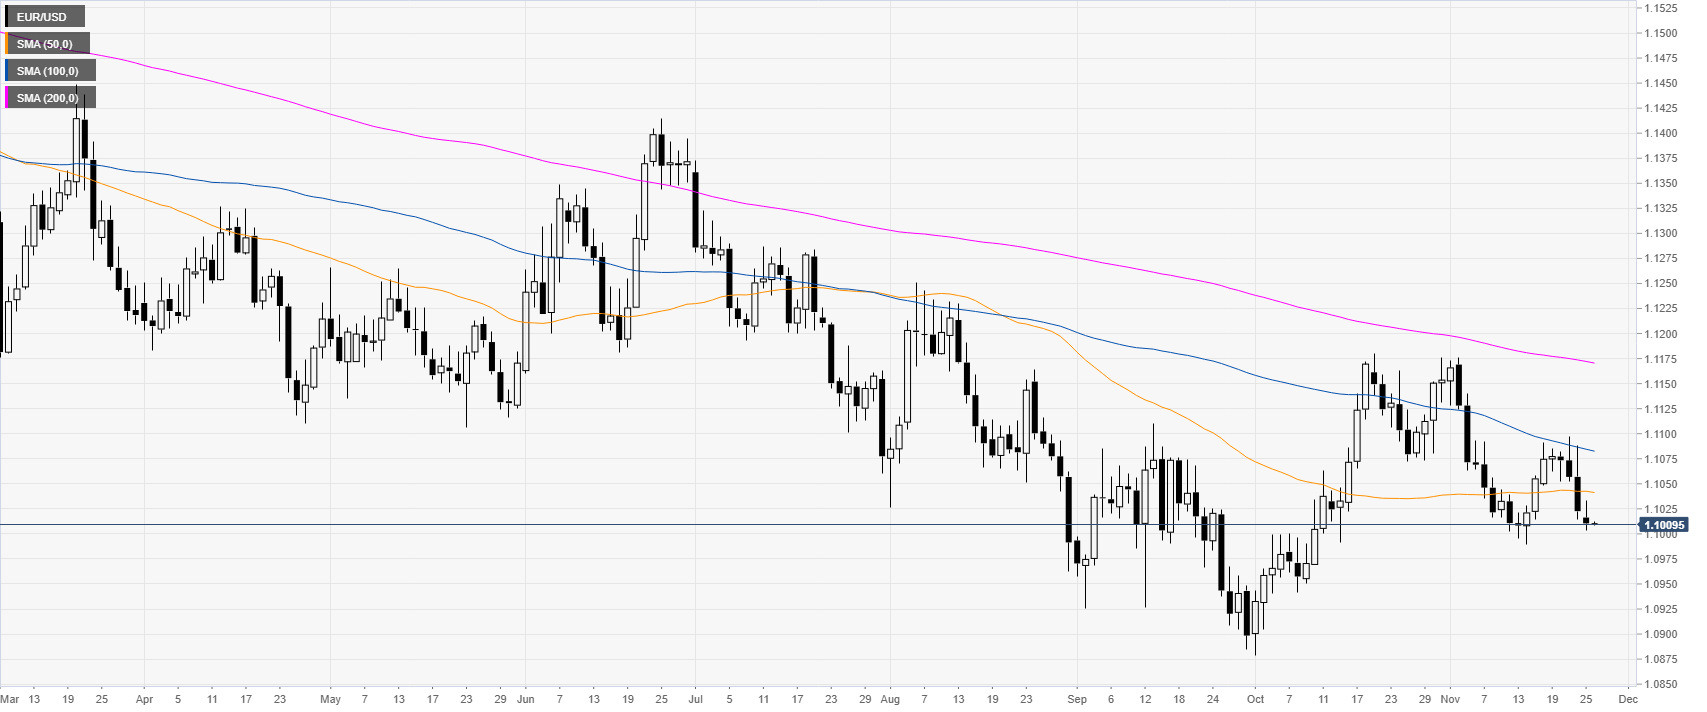
EUR/USD daily chart
On the daily chart, the fiber is trading in a bear trend below the main daily simple moving averages (DMAs). On the first day of the week, the market has been under mild bearish pressure.
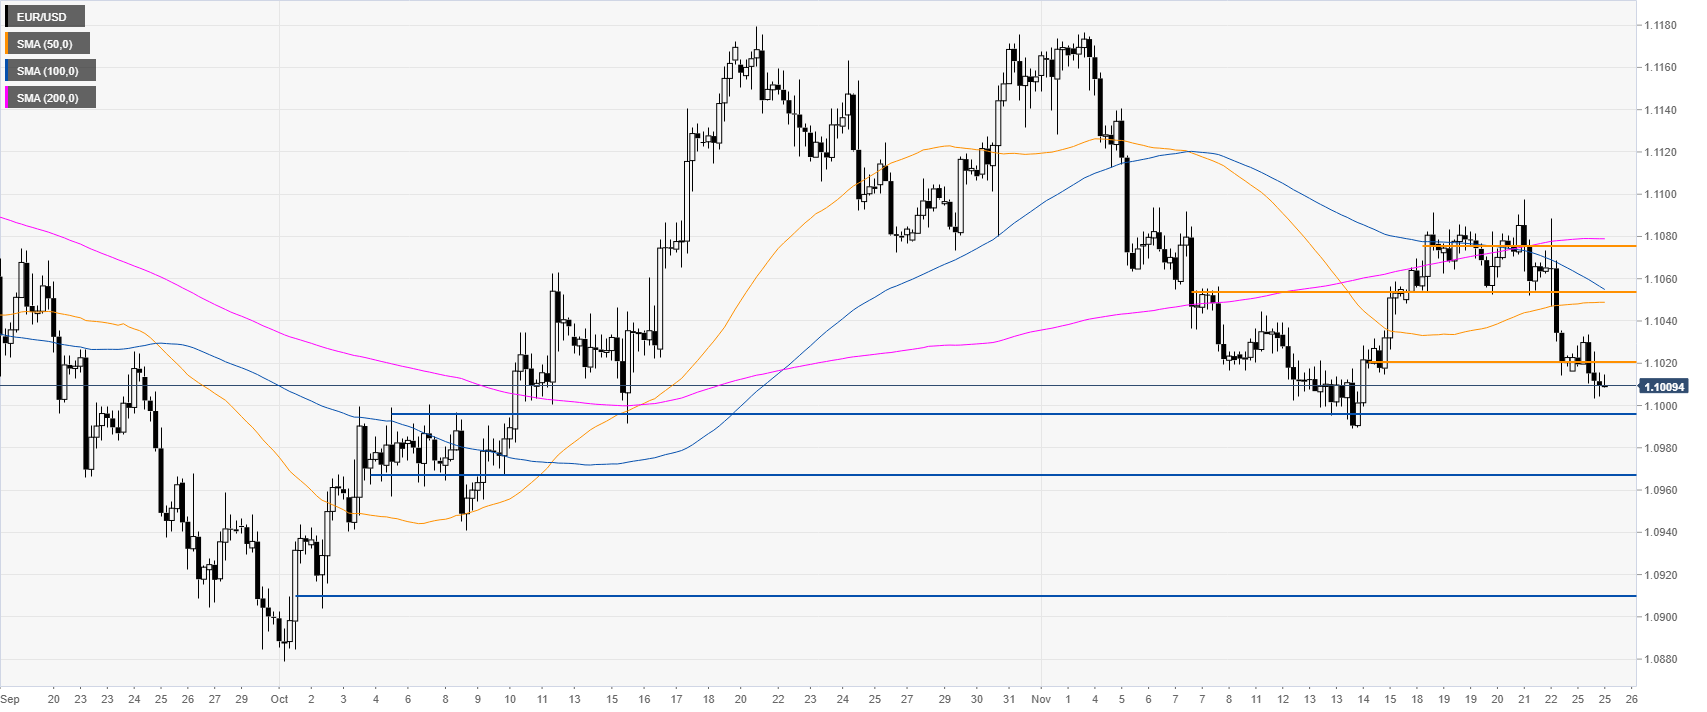
EUR/USD four-hour chart
The spot is nearing the November low while under bearish pressure below the 1.1019 resistance and its main SMAs. The critical support to break for bears is likely located near the 1.0996 level close to the current monthly low. If bears gather enough steam and break this level, the spot could decline towards the 1.0968 and 1.0910 price levels, according to the Technical Confluences Indicator.
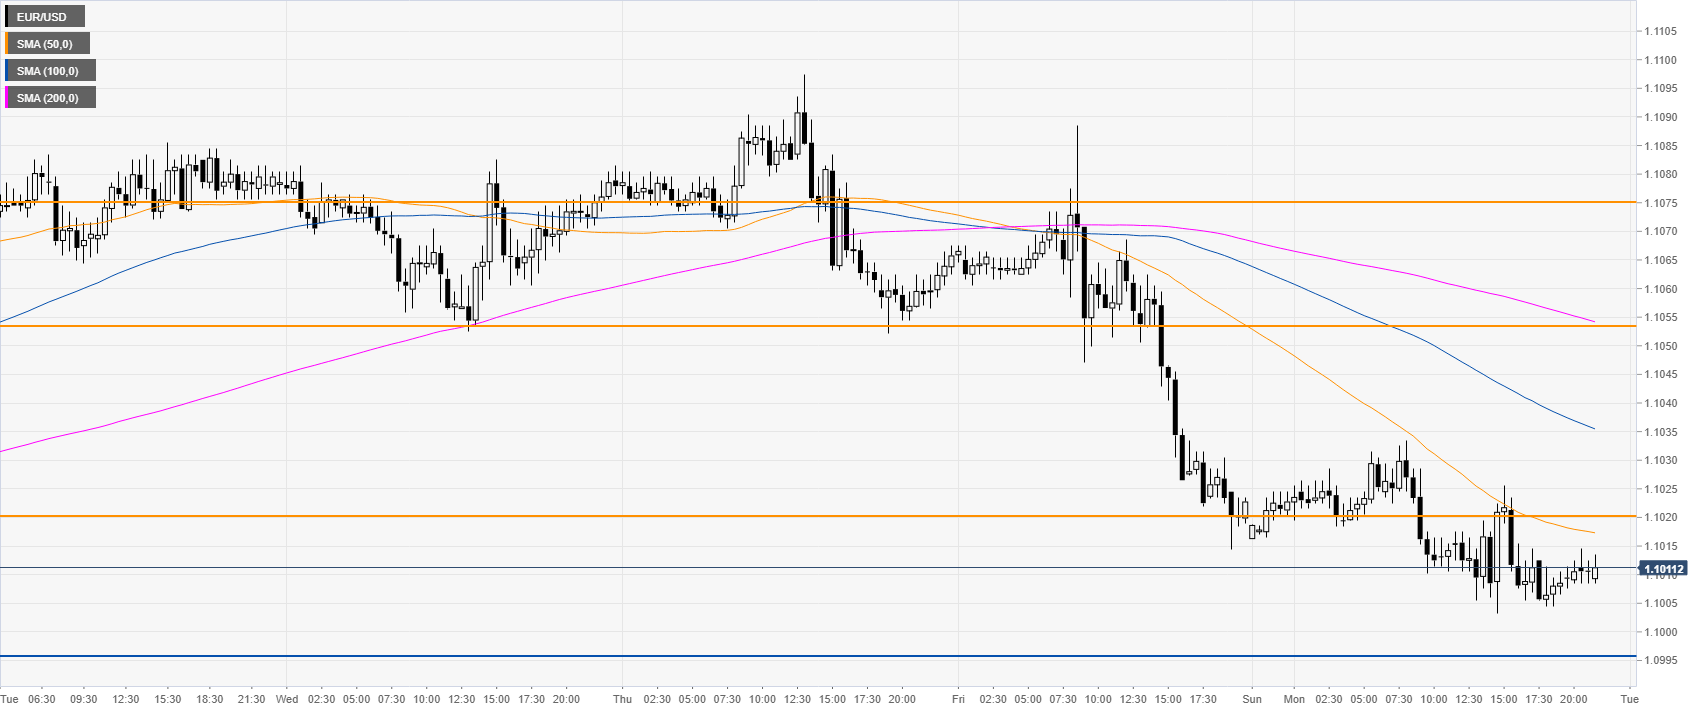
EUR/USD 30-minute chart
EUR/USD has started the week by drifting down while below its main SMAs. Resistance can be expected near the 1.1019 level and at the 1.1054 price level.
On the flip side, a daily close beyond the 1.1076 resistance could question the validity of the bear case in the near term.
Additional key levels