Back


4 May 2020
GBP/USD Price Analysis: Pound down, approaches 1.2400 figure vs. US dollar
- GBP/USD is pulling back down towards the 1.2400 figure.
- GBP/USD faces an important test at the 1.2400 level.
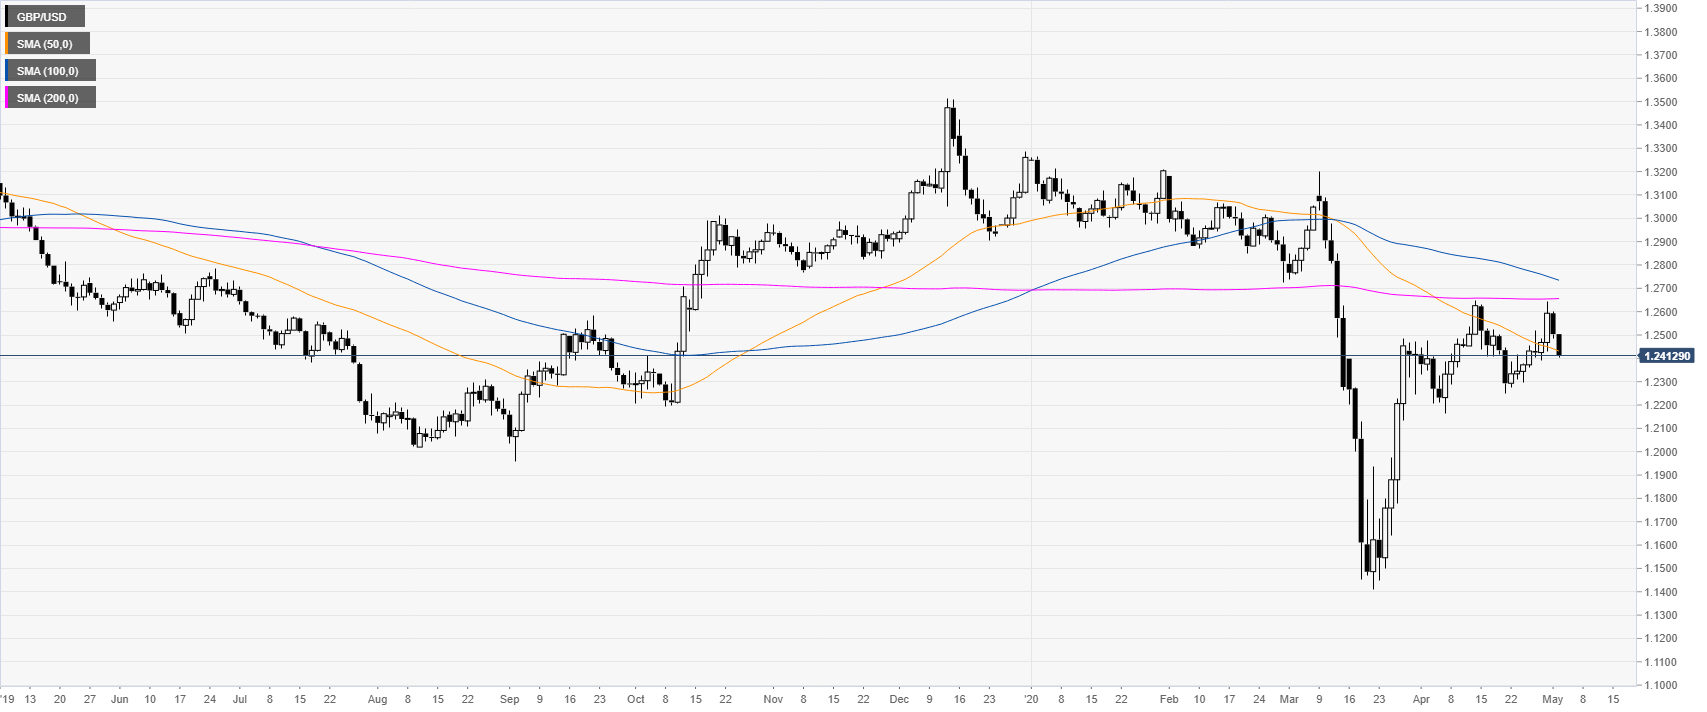
GBP/USD daily chart
GBP/USD is consolidating in the 1.2200/1.2600 zone while trading below its main SMAs on the daily chart. An uptick on the greenback is weighing on the GBP/USD currency pair.

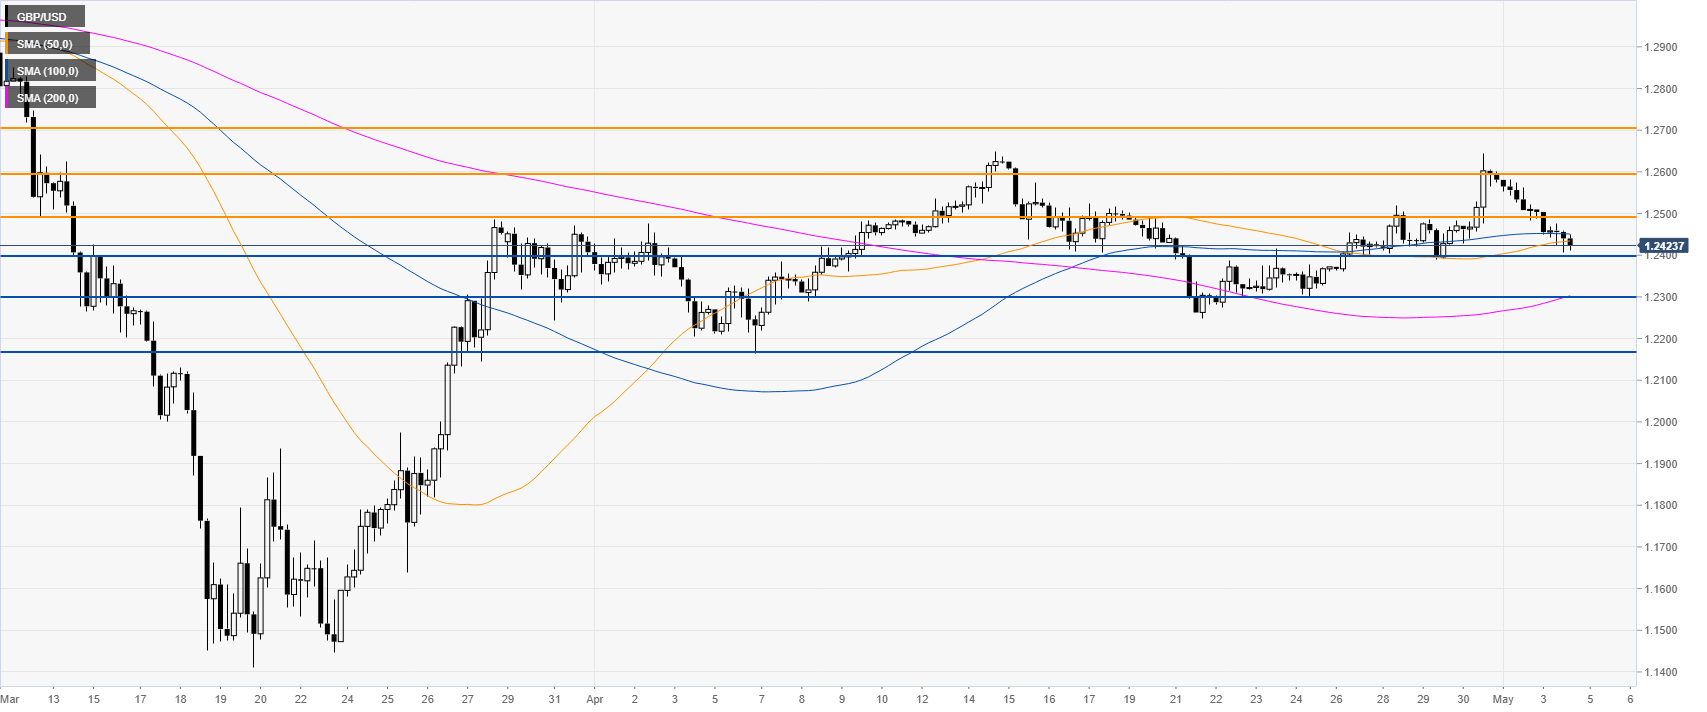
GBP/USD four-hour chart
GBP/USD correction down is approaching the 1.2400 figure while the spot is trading below the 50/100 SMAs but still above the 200 SMA on the four-hour chart. The bulls will attempt to support the market near current levels in order to regain the 1.2500 figure one more time. However, a daily close below the 1.2400 figure can lead to further weakness towards the 1.2300 level. Resistance should emerge near the 1.2500 figure.

Resistance: 1.2500, 1.2600, 1.2700
Support: 1.2400, 1.2300, 1.2165
Additional key levels
