GBP/USD Price Analysis: Bulls battle 1.2800 while refreshing six-week high
- GBP/USD extends pullback from 1.2728 to print fresh high since June 10.
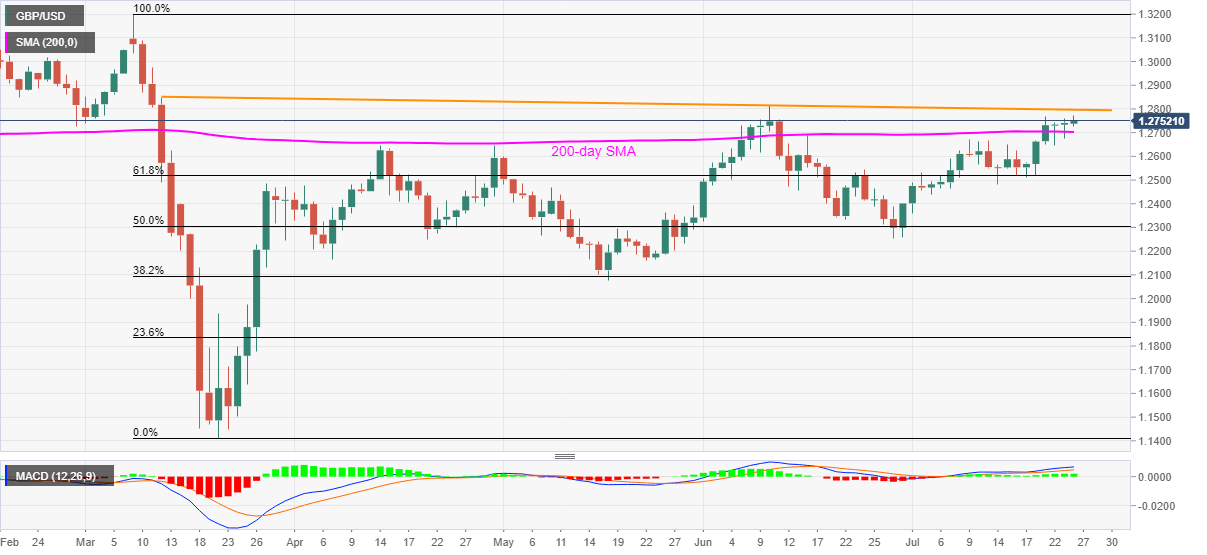
- A falling trend line from March, high marked in June become immediate upside barriers.
- 200-day SMA, 61.8% Fibonacci retracement be the key supports.
GBP/USD takes the bids near 1.2765, up 0.20% on a day, during the early Friday. The Cable surges to the multi-day high while keeping its trade momentum above 200-day SMA amid MACD. As a result, bulls are likely to attack 1.2800 comprising the resistance line stretched from March 12.
Other than the 1.2800 threshold, June month’s high of 1.2813 and February 20 bottom surrounding 1.2850 will also be the key for the bulls to tackle.
In a case where the buyers manage to cross 1.2850 resistance, 1.3000 psychological magnet and March month’s top near 1.3200 could regain the market’s attention.
Meanwhile, the pair’s daily closing below 200-day SMA level of 1.2700 triggers fresh selling towards 61.8% Fibonacci retracement level of March month’s fall, at 1.2517. In doing so, the early-month high around 1.2670 may offer an intermediate halt.
In a case where the sellers dominate past-1.2517, 1.2500 will validate further weakness targeting the June monthly low near 1.2250.
GBP/USD daily chart
Trend: Bullish