GBP/USD Price Analysis: Teases two-month-old triangle support below 1.3700
- GBP/USD struggles to extend the first positive daily closing in last four.
- Bearish MACD, sustained trading below key horizontal area keeps sellers hopeful.
GBP/USD seesaws around monthly low, after snapping a three-day downtrend the previous day. That said, the cable pair trades near 1.3665 by the press time of the initial Asian session on Wednesday.
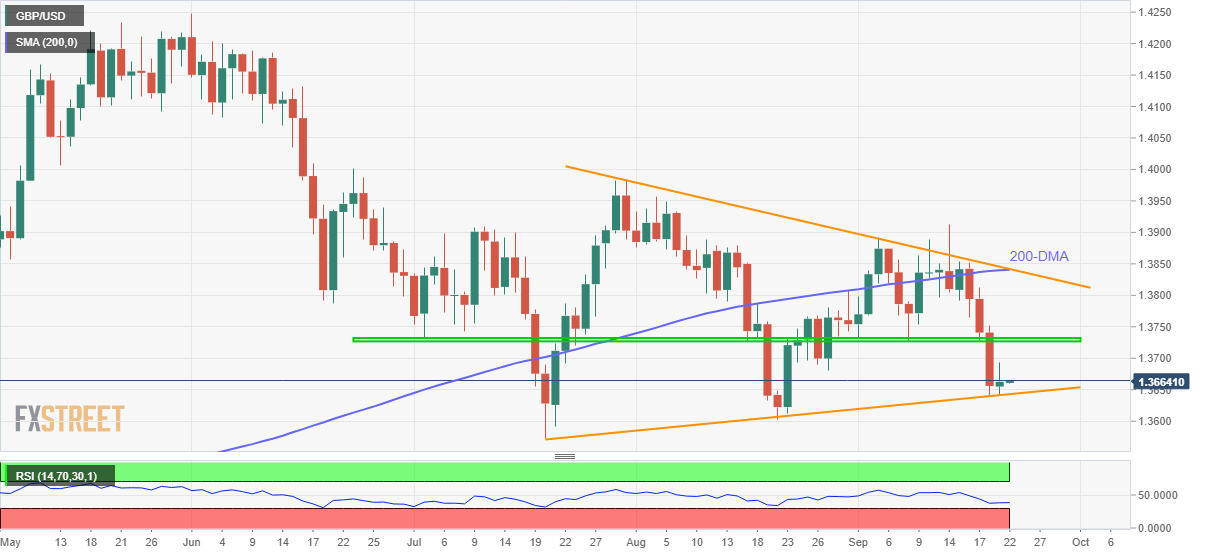
In doing so, the quote nears the support line of a two-month-old symmetrical triangle.
Given the nearly oversold RSI conditions and price-positive candlestick formation, the GBP/USD rebound is likely to extend towards the 1.3700 threshold.
However, a horizontal resistance established since early July, near 1.3730-35, will challenge the pair buyers afterward.
Should GBP/USD crosses the 1.3735 hurdles, a convergence of the triangle’s resistance line and 200-DMA, near 1.3840, will be a tough nut to crack for the bulls.
Meanwhile, a downside break of the stated triangle’s support, around 1.3640, becomes the key immediate level to watch during the fresh declines.
In a case where the GBP/USD sellers keep reins past 1.3640, the yearly low of 1.3570 will be in danger.
GBP/USD: Daily chart
Trend: Corrective pullback expected