EUR/USD Price Analysis: Inches closer to 1.1420-10 support zone
- EUR/USD remains heavy near the lowest levels in 16 months.
- Bearish MACD, sustained trading below October’s trough allow sellers extra time.
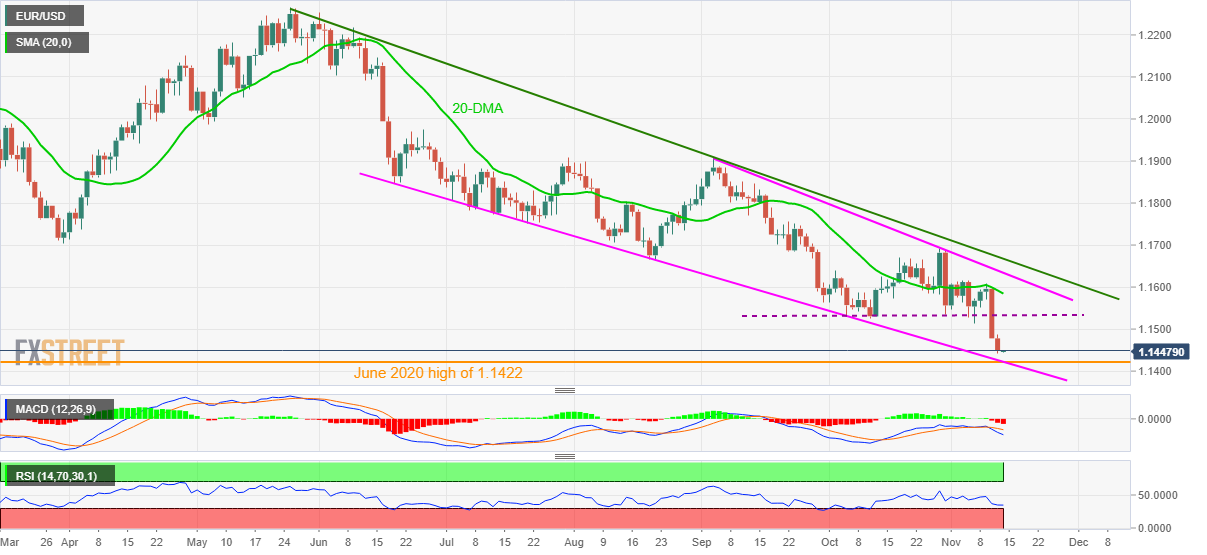
- Five-month-old support line joins June 2020 peak to highlight 1.1420-10 as the key area.
- Monthly horizontal line guards immediate upside ahead of 20-DMA.
EUR/USD bears take a breather around the July 2020 levels following a two-day downtrend, taking rounds to 1.1450 during Friday’s early Asian session.
The major currency pair’s slump could be linked to the clear downside break of a horizontal area comprising multiple levels marked since early October. Also favoring sellers are the bearish MACD signals.
However, a convergence of a five-month-long descending trend line and high marked in June 2020 offer a tough nut a crack for the EUR/USD sellers around 1.1420-10 zone. The nearly oversold RSI conditions also highlight the importance of the said support region.
It’s worth noting that the 1.1400 threshold adds to the downside filter and allows counter-trend traders an extra opportunity for taking the risk.
On the other hand, corrective pullback remains less lucrative until the quote stay below one-month-old horizontal resistance, previous support around 1.1530.
Following that, the 20-DMA and a descending resistance line from September, respectively around 1.1585 and 1.1635, will be in focus.
Adding to the upside filters is the downward sloping trend line from May, close to 1.1670 at the latest.
EUR/USD: Daily chart

Trend: Further declines limited
