Gold Price Forecast: Battle lines well-mapped around $1,800 ahead of key event risks – Confluence Detector
- Gold price recovery eyes $1,800 but sellers refuse to give up yet.
- US dollar corrects from 18-month peak, offers temporary reprieve to gold bulls.
- Gold Price set to test key $1,775 support, as a big week kicks off.
Gold price has kicked off a busy week on a wrong footing, as the Fed’s hawkishness continues to play out strong. Further, the RBA and BOE are expected to deliver a hawkish stance at their monetary policy meetings this week, making the non-interest-bearing gold less appealing. However, bulls are finding some temporary reprieve, courtesy of the corrective pullback in the US dollar alongside the Treasury yields. Looking forward, traders will eagerly await the key central banks’ meetings and the top-tier US economic data for the next direction in gold price.
Read: Forex Today: Dollar bulls take a breather amid a quiet start to a Big week
Gold Price: Key levels to watch
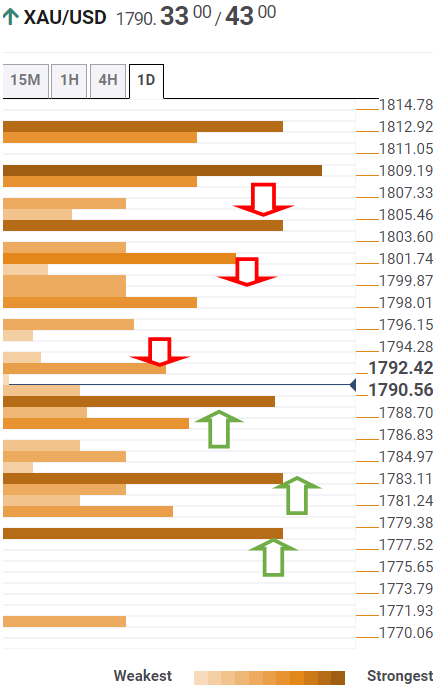
The Technical Confluences Detector shows that the gold price is battling strong resistance around $1,791, where the Fibonacci 61.8% one-day aligns.
The next resistance is seen at $1,796, the SMA100 one-day. A sustained move above the latter will see a test of a dense cluster of healthy resistance levels around $1,800.
That point is the convergence of the pivot point one-day R1, the previous day’s high and Fibonacci 23.6% one-week.
Further up, gold buyers will then aim for a powerful barrier at $1,806, which is the SMA200 one-day.
On the flip side, defending the daily lows of $1,786 is critical for gold bulls, below which a fresh downside could kick in towards the $1,782-$1,780 price zone.
The demand area is the confluence of the previous day’s low, Fibonacci 61.8% one-month and pivot point one-day S1.
The next stop for sellers is seen at the pivot point one-month S1 of $1,779.
Here is how it looks on the tool
About Technical Confluences Detector
The TCD (Technical Confluences Detector) is a tool to locate and point out those price levels where there is a congestion of indicators, moving averages, Fibonacci levels, Pivot Points, etc. If you are a short-term trader, you will find entry points for counter-trend strategies and hunt a few points at a time. If you are a medium-to-long-term trader, this tool will allow you to know in advance the price levels where a medium-to-long-term trend may stop and rest, where to unwind positions, or where to increase your position size.